


What is the Bull vs Bear Indicator? When trading forex, you will often hear people say, “The market is bullish!” or “Beware, it’s a bear market!”
But what do these terms mean, and how do traders predict them? This is where the Bull and Bear Indicator comes into play.
This tool helps traders understand market trends and make smarter decisions. If you want to know how it works, how to use it, and whether it is right for your trading strategy, then keep reading.
But, before looking into the Bull and Bear Indicator, it’s important to understand what bull and bear markets are, as they play a significant role in determining how the indicator functions.
Let’s explain these concepts to ensure clarity.
In This Post
What Is a Bull Market?
A bull market is a financial market where prices are rising or are expected to rise. This term is often used in the context of stocks, commodities, or forex trading, but it can apply to any asset.
In a bull market, investors are optimistic and have confidence that the upward trend will continue for a while.
During this period, people are buying assets in anticipation that the prices will keep increasing, and they can later sell them for a profit.
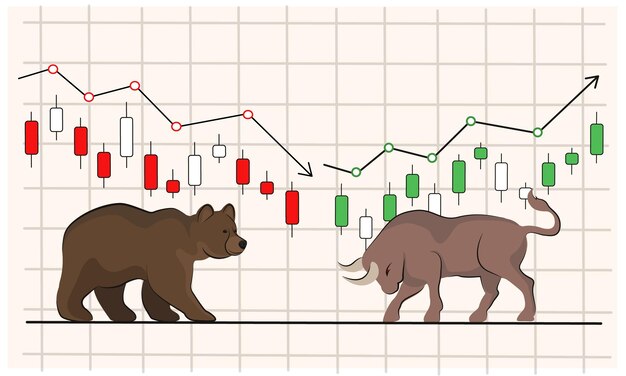
The term “bull” is used because, just like a bull that attacks with its horns, pushing upwards, the market trends when it’s in a bull phase.
When people think of a bull market, they often think of growth, optimism, and opportunity. Traders in this market are mainly focused on buying assets at lower prices and selling them when prices rise.
Let’s take, for instance, a trader who sees that the price of a currency pair, like EUR/USD, has been increasing steadily over a few weeks.
This gives the trader confidence that the value of the euro will continue to increase against the US dollar.
The trader then decides to buy the euro, hoping to sell it later when the price is even higher.
What Is Bear Market?
A bear market, in contrast, is the opposite of a bull market. It occurs when prices are falling or are expected to fall.
In a bear market, the mood is generally negative, and traders expect a prolonged downturn.
Fear dominates the market, and many traders start selling their positions to minimize losses, anticipating that the market will continue to decline.
The term “bear” is used because, just like a bear swipes downward with its claws, a bear market sees a sharp decline in asset prices.
This creates a cycle of fear, as investors attempt to get out of positions before they lose more money. Traders in this market focus on selling their assets to avoid further losses.
If a trader sees that the price of the same EUR/USD pair is consistently falling, the trader might decide to sell the euro, expecting that the value will continue to decrease relative to the US dollar.
By selling, the trader hopes to buy it back at a lower price.
The Metaphor of Bull and Bear Markets
To better understand the difference between these two types of markets, let’s revisit the metaphor.
A bull, when attacking, charges forward, pushing its horns up into the air. This represents the market’s upward movement.
On the other hand, a bear, when attacking, swipes its claws downward, symbolizing the market’s downward movement.
What is the Bull and Bear Indicator?
The Bull and Bear Indicator is a technical analysis tool used to measure the prevailing sentiment of the market, whether buyers (bulls) or sellers (bears) have the upper hand.
Essentially, this indicator helps traders gauge whether the market is more likely to rise or fall, based on current price trends, volume, and market psychology.
The indicator uses various calculations and formulas to assess which side is dominating the market.
This information is invaluable for traders, as it allows them to make more informed decisions about whether to buy or sell.
The Bull and Bear Indicator provides answers to questions such as:
- Should I buy or sell in the current market?
- Is the market trending upward (bullish) or downward (bearish)?
- Are there more buyers or more sellers in the market right now?
- Is the market strong or weak?
By analyzing these market sentiments, traders can position themselves better to capitalize on profitable trends or avoid losses.
Example
A trader who sees that the Bull vs Bear Indicator is showing a bullish trend might decide to enter a buy position on a currency pair, expecting the value to go up.
Conversely, if the indicator shows a bearish trend, the trader might consider selling or staying out of the market.
How Does the Bull and Bear Indicator Work?
The Bull and Bear Indicator works by assessing various elements of the market, such as price action, trading volume, and market sentiment, to give traders a clear picture of which side is currently in control.
Below are the primary components that influence how the indicator functions:
1. Price Action
Price action refers to the way prices move in the market. It is one of the most critical factors in the Bull vs Bear Indicator.
Traders closely watch price trends, whether they are rising, falling, or moving sideways—to gauge the market’s strength.
- Uptrend (Bullish): A consistent price rise suggests that the bulls are in control.
- Downtrend (Bearish): A steady price decline indicates that the bears have the upper hand.
- Sideways (Neutral): If prices are moving sideways without a clear direction, the market might be in consolidation, meaning neither side is dominating.
2. Trading Volume
Trading volume represents the number of trades made within a specific period. Volume analysis helps traders understand the strength of a price move.
- High Volume with Rising Prices (Bullish): If the market price is increasing along with a high volume of trades, it signals that there is strong buying pressure. This is a bullish sign.
- High Volume with Falling Prices (Bearish): Conversely, if prices are dropping while trading volume is high, it shows that sellers are in control, making this a bearish signal.
3. Confirming Market Sentiment
Momentum indicators, such as the Relative Strength Index (RSI) and Moving Averages, are tools used to confirm the market’s momentum.
- RSI: This indicator measures whether a currency pair is overbought (bullish) or oversold (bearish). A high RSI (above 70) suggests that the market is overbought and might soon reverse, while a low RSI (below 30) indicates that the market is oversold and could reverse upward.
- Moving Averages: The 50-period and 200-period moving averages are commonly used to determine the market’s trend. If the short-term moving average crosses above the long-term moving average, it’s considered a bullish signal. If the short-term moving average crosses below the long-term moving average, it signals a bearish trend.
How to Use the Bull vs Bear Indicator in Forex Trading
To make profitable trades, you need to use the Bull vs Bear Indicator correctly. These is how:
1. Identify Market Trends
Look at the indicator to see if the market is bullish or bearish. If bulls are stronger, prices will likely go up. If bears are stronger, prices will likely go down.
2. Confirm with Other Indicators
Use additional technical indicators like RSI, MACD, or Moving Averages to confirm the trend.
3. Choose the Right Entry and Exit Points
- Bullish Market: Buy when the indicator shows strong buying pressure.
- Bearish Market: Sell when the indicator shows strong selling pressure.
4. Set Stop Loss and Take Profit
Always use stop loss to minimize risks and take profit to lock in gains when the market moves in your favor.
Example of Using the Bull and Bear Indicator in Forex
Let’s say you are trading EUR/USD and see the following:
The Bull & Bear Indicator shows that bulls are getting stronger.
The RSI confirms the market is not overbought.
The Moving Average is trending upward.
This means it will be a good time to buy because the market is likely to continue rising. If you see the opposite signals, it may be time to sell.
Pros of the Bull vs Bear Indicator
It shows whether the market is bullish or bearish.
It pairs well with RSI, MACD, and Moving Averages.
Works for day traders and long-term investors.
Helps traders make data-driven decisions.
Cons of the Bull vs Bear Indicator
Not Always 100% Accurate: No indicator can predict the market perfectly.
Requires Experience: Beginners may need time to understand how to use it effectively.
Needs Confirmation: This should always be used with other indicators to avoid false signals.
Best Forex Strategies Using the Bull vs Bear Indicator
They are:
1. Trend-Following Strategy
Buy when the market is bullish and sell when the market is bearish.
2. Breakout Strategy
Enter a trade when the market breaks a key resistance or support level.
3. Reversal Strategy
Look for signs of trend reversal when the indicator shows bulls losing strength in an uptrend or bears weakening in a downtrend.
Frequently Asked Questions
Can beginners use the Bull vs Bear Indicator?
- Yes, but beginners should practice using it on a demo account before trading real money.
Is the Bull vs Bear Indicator enough to trade forex successfully?
- No. Always combine it with other indicators like RSI and Moving Averages for better accuracy.
What timeframe is best for the Bull vs Bear Indicator?
- It depends on your trading style. Day traders use short timeframes (15 min – 1 hour), while long-term traders use higher timeframes (4 hours – daily charts).
Does the Bull vs Bear Indicator work in all market conditions?
- No. It works best in trending markets but can give false signals in sideways (range-bound) markets.
Conclusion
The Bull vs Bear Indicator is a tool in forex trading that helps traders identify whether bulls (buyers) or bears (sellers) are in control.
When used correctly, it can improve your trading decisions and help you stay ahead of market trends.
However, no indicator is perfect. Always confirm signals with other indicators and follow risk management rules to protect your capital.
If you found this guide helpful, share it with other traders and drop your questions in the comments.
