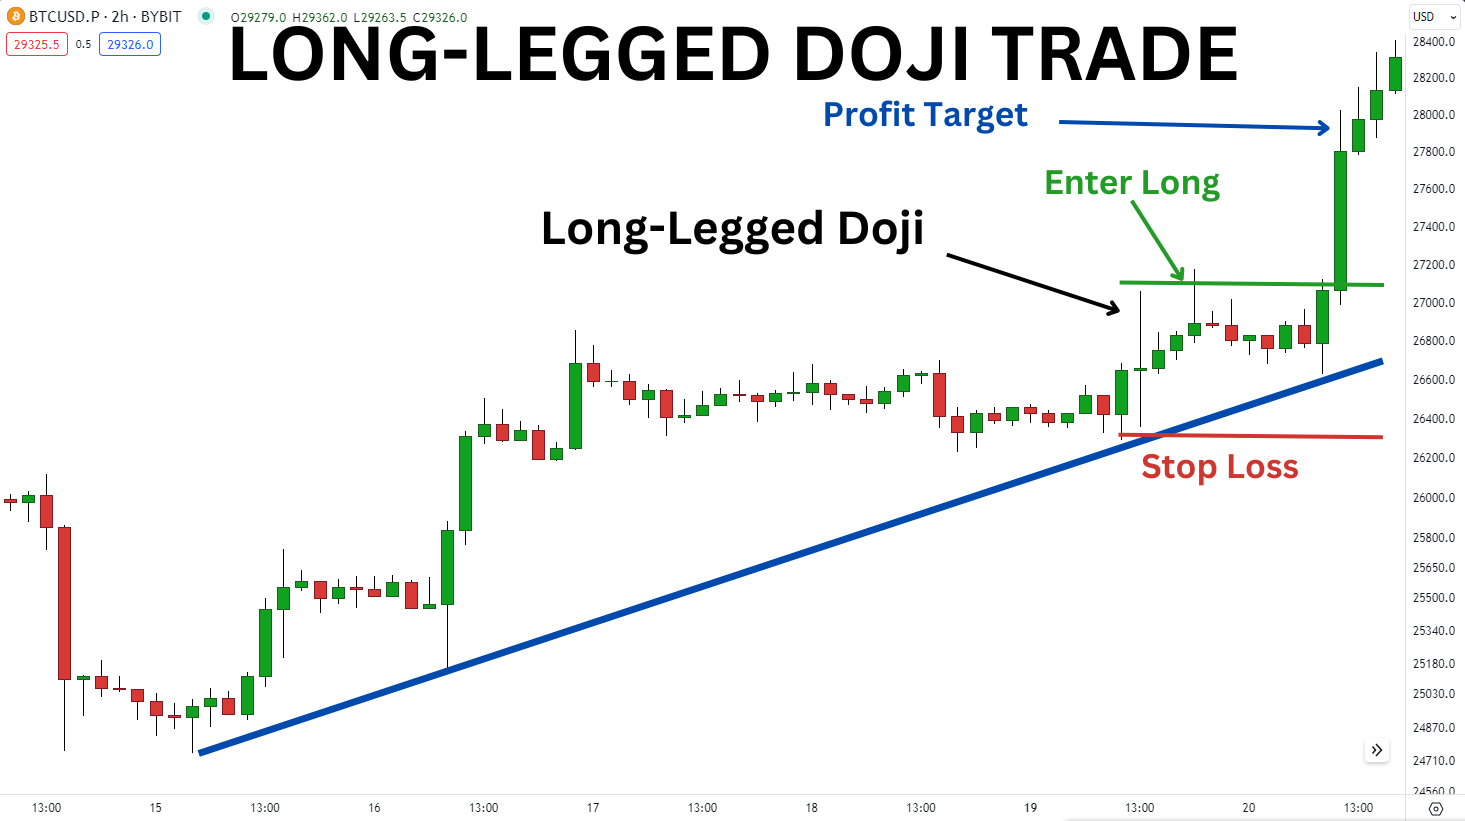
A Long-Legged Doji is a special type of candlestick pattern that appears on a chart when the starting and ending prices of a currency pair are almost the same. However, during that time, the prices went up and down a lot, creating a candlestick that looked like a cross or a plus sign with long lines (called shadows or wicks) on both sides.
The main thing that makes a Long-Legged Doji different is its long shadows. These shadows show that prices moved a lot during that time but ended up close to where they started. This pattern is unique because it shows that the market couldn’t decide which direction to go, making it different from other Doji patterns like the standard Doji or the Dragonfly Doji.
In This Post
Why is the Long-Legged Doji Important in Forex Trading?
In Forex trading, a Long-Legged Doji often means that the market is uncertain or confused. This pattern shows that neither buyers nor sellers could take control during the trading session, so the market ended in a tie. This indecision might happen after a strong trend, hinting at a possible change in direction, or during a time when the market is moving sideways, showing that it still hasn’t decided where to go next.
When traders see a Long-Legged Doji, they usually become cautious. The pattern doesn’t tell them which way the market will go, but it warns them that a big move might be coming soon once the market decides. Because of this, traders often use the Long-Legged Doji along with other tools and indicators to figure out if the trend will continue or reverse.

How to Trade Using the Long-Legged Doji
Trading with the Long-Legged Doji takes careful watching and checking with other indicators. Here are some tips on how to trade when you spot this pattern:
- Wait for Confirmation: Don’t make a move just because you see a Long-Legged Doji. Wait for the next candlestick to show you the market’s direction. If the next candlestick moves strongly in the opposite direction of the previous trend, it might confirm a reversal. If the trend continues, the Doji might just be a short pause.
- Use Other Indicators: Combine the Long-Legged Doji with other technical tools like moving averages, the Relative Strength Index (RSI), or the Moving Average Convergence Divergence (MACD). For example, if the Doji shows up near a strong support or resistance level and other indicators suggest a reversal, it could be a good time to trade.
- Manage Your Risk: Because this candlestick pattern shows market uncertainty, it’s important to be careful with your trades. Set stop-loss orders and choose your position sizes wisely to protect yourself from unexpected market movements.
Examples In Historical Charts
Looking at historical charts can help you see how the Long-Legged Doji has worked in different market situations. For example, during times of high market volatility, like during big news events or geopolitical issues, the Long-Legged Doji might show up often, reflecting the market’s hesitation.
In one example, this candlestick pattern appeared after a long downtrend in the EUR/USD pair. After this pattern, a bullish reversal followed, confirmed by a strong upward candlestick and rising momentum indicators. Traders who noticed this pattern and acted quickly could have made a profit from the following uptrend.


