


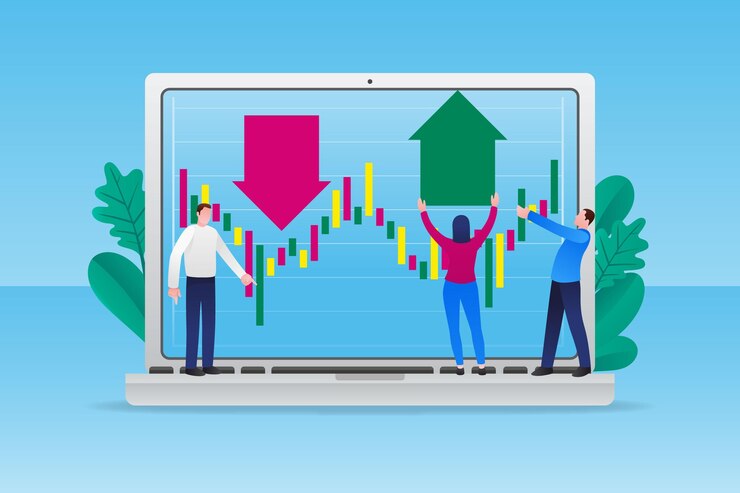
The Intraday Momentum Index (IMI) is a powerful tool designed to help Forex traders gauge the strength of price movements throughout a trading day. It combines the concepts of momentum and volume to provide traders with critical insights into market conditions.
As the Forex market becomes increasingly dynamic, the popularity of momentum indicators like the IMI is on the rise. Traders are constantly seeking ways to enhance their strategies, and the IMI stands out as a robust option.
Understanding the IMI can significantly improve trading decisions by providing real-time analysis of price momentum, allowing traders to enter and exit positions with greater confidence.
In This Post
What is the Intraday Momentum Index?
The Intraday Momentum Index (IMI) is a technical indicator that measures the momentum of price movements over a single trading day.
It is particularly useful for day traders who seek to capitalize on short-term price fluctuations in the Forex market. The formula for calculating the IMI incorporates both the price changes and the volume of trades, making it a nuanced indicator.
The IMI is derived from the average price change in an up period versus the average price change in a down period, providing a balanced view of market momentum.
Unlike other momentum indicators, such as the Relative Strength Index (RSI), which often consider closing prices over longer periods, the IMI focuses specifically on intraday price actions.
This unique perspective allows traders to identify potential entry and exit points based on real-time momentum shifts, enhancing their trading strategies.
How IMI Works in Forex Trading
The Intraday Momentum Index (IMI) operates by measuring the momentum of price changes within a single trading day.
It assesses the strength of price movements by comparing the number of bullish (upward) price changes to bearish (downward) price changes over a specified time frame, typically during a single trading session. This gives traders insight into whether the current trend is gaining or losing strength.
In the context of the IMI, the concepts of overbought and oversold conditions are crucial. An IMI value above 70 typically indicates that the market is overbought, suggesting a potential price reversal or correction.
An IMI value below 30 suggests that the market is oversold, which may present buying opportunities as prices could rebound.
The IMI ranges from 0 to 100, with values near 50 indicating a neutral momentum phase. Values exceeding 70 signal strong bullish momentum, while values below 30 indicate strong bearish momentum.
Understanding these ranges helps traders make informed decisions about when to enter or exit positions based on prevailing market conditions.
Calculation of Intraday Momentum Index
Calculating the Intraday Momentum Index involves several steps that require specific price data: the opening price, highest price, lowest price, and closing price of the asset. The formula for calculating the IMI is as follows:
Up Average
IMI = 100 X ___________________________________
Up Average + Down Average
Step 1: Identify the period for your calculation (e.g., 14 periods).
Step 2: For each period, determine the following:
Up Moves: If the closing price is higher than the opening price, calculate the price change (Close – Open).
Down Moves: If the closing price is lower than the opening price, calculate the price change (Open – Close).
Step 3: Compute the average of the up moves and down moves over the selected period.
Step 4: Substitute the averages into the IMI formula to obtain the value.
Illustrative Example:
Period: Let’s say we calculate the IMI for 5 trading sessions with the following price data:
| Session | Open | Close | Up Move | Down Move |
|---|---|---|---|---|
| 1 | 1.1000 | 1.1050 | 0.0050 | 0.0000 |
| 2 | 1.1050 | 1.1020 | 0.0000 | 0.0030 |
| 3 | 1.1020 | 1.1060 | 0.0040 | 0.0000 |
| 4 | 1.1060 | 1.1030 | 0.0000 | 0.0030 |
| 5 | 1.1030 | 1.1080 | 0.0050 | 0.0000 |
Up Moves Total: 0.0050 + 0.0040 + 0.0050 = 0.0140
Down Moves Total: 0.0030 + 0.0030 = 0.0060
Average Up Moves: 0.0140 / 5 = 0.0028
Average Down Moves: 0.0060 / 5 = 0.0012
IMI Calculation:
IMI= 100 X 0.0028
________________ = 100 X 0.0028
0.0028 + 0.0012 ________ = 70
0.0040
How to use IMI in Forex Trading Strategies
Here are two primary strategies where the IMI can be effectively utilized:
1. Trend-Following Strategies
In a trend-following strategy, traders use the IMI to confirm the strength of a prevailing trend. When the IMI is above 70, it indicates a strong upward momentum, prompting traders to consider long positions.
On the other hand, an IMI below 30 suggests strong bearish momentum, signalling potential short positions.
Consider a chart where the IMI crosses above 70 during an upward trend. Traders might enter a buy order when the IMI exceeds this threshold and place a stop-loss below the most recent swing low to manage risk.
2. Reversal Strategies
Reversal strategies leverage the IMI to identify potential turning points in the market. When the IMI reaches extreme levels (above 70 or below 30), it may signal an impending price reversal.
On a chart, if the IMI spikes above 80 and the price action starts to show signs of exhaustion (e.g., forming a bearish candlestick pattern), traders could enter a sell order while setting a stop-loss above the recent high.
Advantages of Using IMI
Utilizing the Intraday Momentum Index offers several significant benefits for Forex traders:
1. Quick Identification of Momentum Shifts
The IMI allows traders to quickly assess market momentum, enabling timely decisions that can capitalize on price movements.
2. Enhanced Decision-Making for Entry and Exit Points
By understanding overbought and oversold conditions, traders can make more informed decisions about when to enter or exit trades, improving overall trade outcomes.
3. Compatibility with Other Indicators for Comprehensive Analysis
The IMI works well alongside other technical indicators (such as RSI or MACD), providing a holistic view of market dynamics and enhancing the robustness of trading strategies.
Common Pitfalls When Using IMI
Despite its usefulness, traders can make common mistakes when utilizing the IMI:
1. Ignoring Other Market Indicators
Relying solely on the IMI can lead to poor decisions. It’s crucial to confirm signals with additional indicators to avoid false signals.
2. Misinterpreting Overbought and Oversold Signals
Traders may mistakenly assume that an overbought signal (IMI above 70) always indicates a sell opportunity. However, in a strong trend, prices can remain overbought for extended periods.
3. Actionable Tips to Avoid Pitfalls
Always combine the IMI with other indicators to validate signals.
Be cautious with overbought and oversold levels; consider the overall trend before making decisions.
Regularly backtest your strategies to understand how the IMI performs in different market conditions.
Indicators that are Combined with IMI
Combining the Intraday Momentum Index (IMI) with other technical indicators can improve the accuracy of trading signals and provide a more comprehensive market view.
Here are key indicators that pair well with the IMI:
1. Moving Averages
Moving Averages help smooth out price data to identify trends. When used alongside the IMI, Moving Averages can confirm the strength and direction of a trend, providing clearer signals for entry or exit.
2. RSI (Relative Strength Index)
The RSI is another momentum indicator that identifies overbought or oversold conditions. When paired with the IMI, traders can double-check momentum shifts to reduce false signals.
3. MACD (Moving Average Convergence Divergence)
MACD is a trend-following momentum indicator. Using it in conjunction with the IMI can offer extra confirmation, especially during crossovers of moving averages and shifts in momentum.
Combining these indicators with the IMI adds layers of analysis, improving the accuracy of your trading strategy and reducing the risk of false signals.
Backtesting IMI Strategies
It is an essential process for determining the historical performance of any trading strategy, including those that use the IMI.
Backtesting IMI strategies helps traders understand how the index would have performed under past market conditions, allowing them to refine and optimize their approach.
Popular platforms like MetaTrader 4/5, TradingView, and NinjaTrader offer robust backtesting features that can help you simulate IMI strategies over historical data to assess their viability.
Step-by-Step Guide to Backtesting
- Collect historical price data for your chosen currency pair.
- Apply your IMI trading strategy to historical data.
- Record trade outcomes and performance metrics such as win/loss ratio, drawdowns, and overall profitability. 10.
Frequently Asked Questions
1. What is the ideal IMI setting for Forex trading?
The default setting for the IMI is 14 periods, but traders can adjust this based on their specific trading style and time frame. Shorter time frames may require a lower setting, while longer-term traders might prefer a higher period setting for smoother signals.
2. Can IMI be used in conjunction with other trading styles beyond day trading?
Yes, while the IMI is commonly used in intraday trading, it can also be applied to swing trading or even longer-term strategies. The key is adjusting the IMI settings to fit the time frame of your trades.
3. How does news volatility affect the accuracy of the IMI?
Significant news events can cause rapid price fluctuations, which might lead to false IMI signals. During high-volatility periods, it’s important to combine the IMI with other indicators and avoid over-reliance on momentum indicators alone.
Conclusion
To conclude, the Intraday Momentum Index (IMI) is a powerful momentum indicator that Forex traders can use to identify overbought and oversold conditions during a trading day.
When you know how to calculate and apply the IMI, you can enhance their trading strategies and make better-informed decisions.
Mastering the IMI and combining it with other technical indicators like Moving Averages, RSI, and MACD can improve the accuracy of your trades.
Always backtest your IMI strategies before applying them in live markets to ensure their effectiveness in different market conditions.
Consider starting with a demo account to practice and refine your strategy without risking real money.
